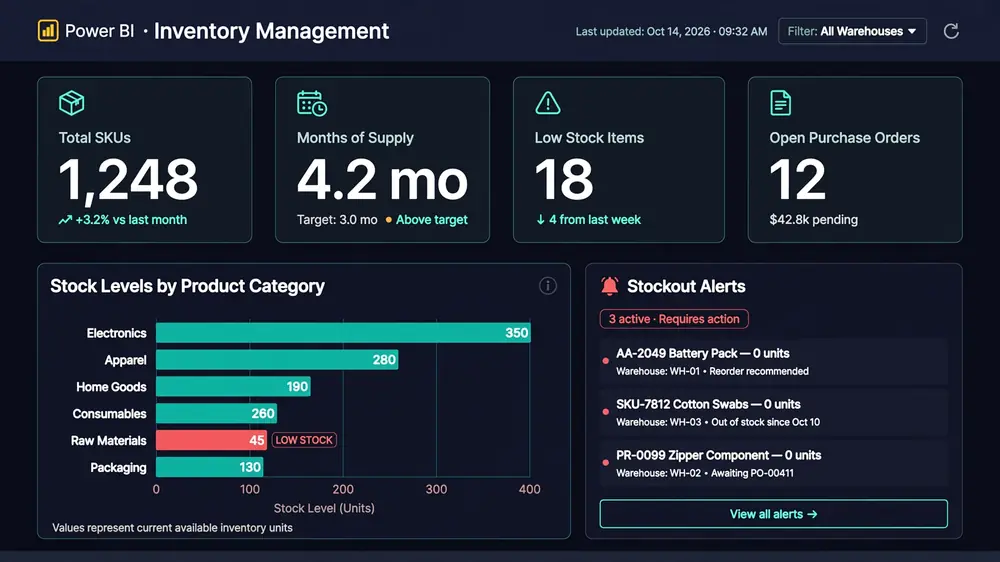
Inventory intelligence
Know Your Stock Position
Months of supply for every item, open purchase orders with expected arrival dates, and alerts before you hit a stockout.
Wiseman Analytics connects your sales, inventory, and financial data into Power BI dashboards you can actually use — stock levels, customer growth, sales targets, and P&L, all in one place. Every dashboard is tailored to your business — nothing generic, nothing off-the-shelf.
For a few local businesses: I’ll connect your sales, inventory, or financial data into Power BI dashboards you can actually use. Two months, no cost, no strings — if it doesn’t change how you run your business, we shake hands and part ways.
Clear, role-ready views turn complex operational data into the next best action.
Months of supply for every item, open purchase orders with expected arrival dates, and alerts before you hit a stockout.
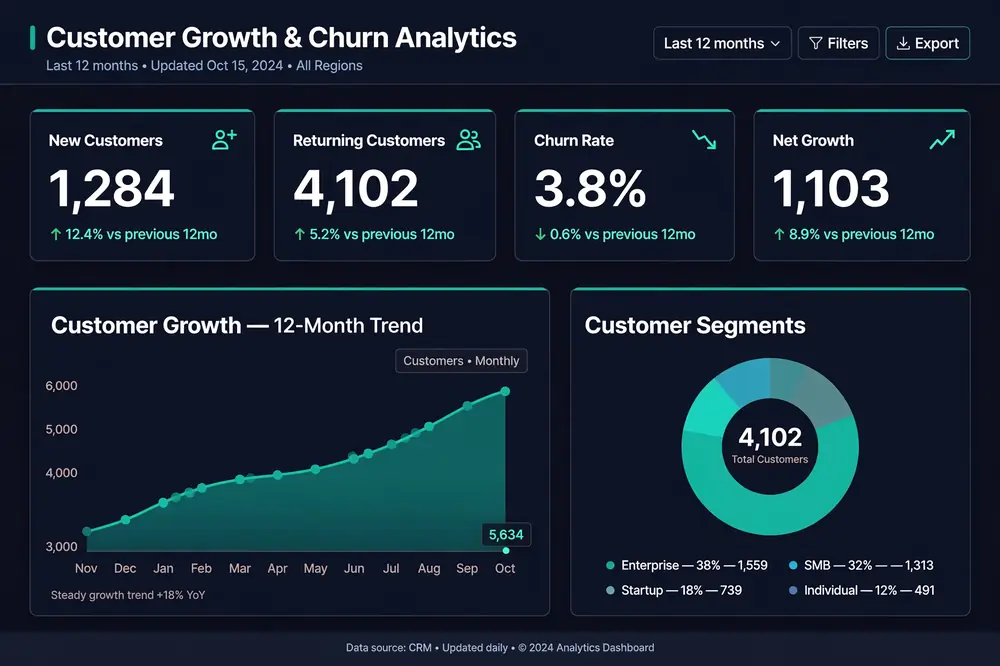
Track new, returning, and lost customers. Spot churn segments early and focus on the customers that drive growth.
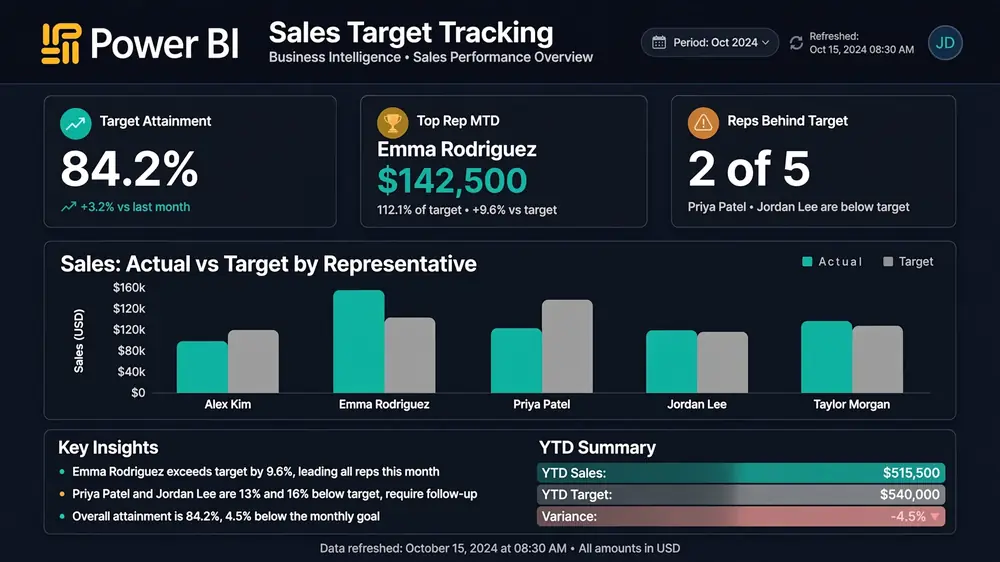
Actual vs. target by rep, region, or period — always current, always visible, so nothing slips through the cracks.
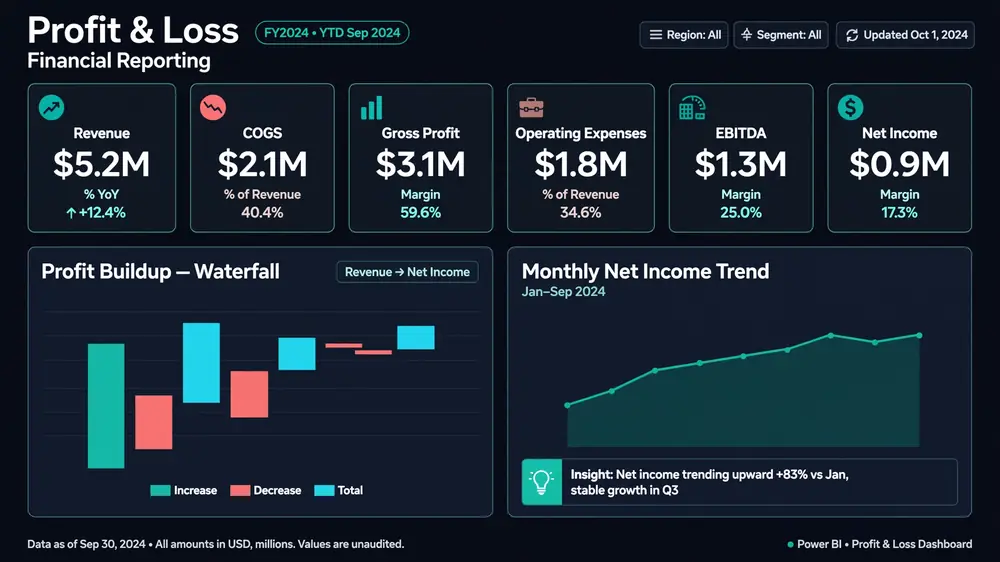
Revenues, expenses, gross profit and net profit — broken down by maintenance, office, and every cost center. View by branch or the full year: one dynamic report that updates as your business moves.
Every dashboard is built around your business — nothing generic. And every view ends in a next step: reorder stock, follow up with a customer, adjust a target.
In-person support across Tucson and Greater Phoenix, including Scottsdale — plus remote delivery anywhere in the US.
5+ years building BI for retail and wholesale. Battle-tested models for inventory, growth, and finance — not experiments.
Tell us about your business and we’ll show you the insights your team can act on immediately.